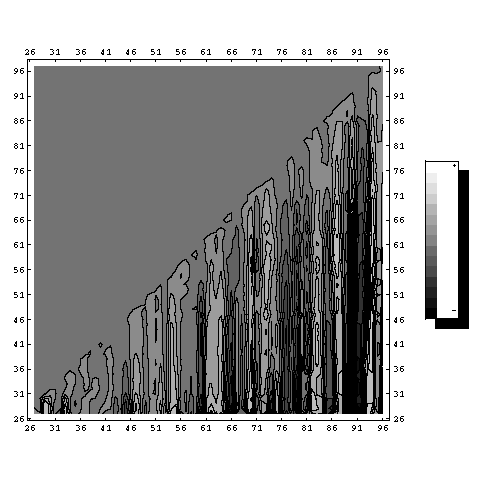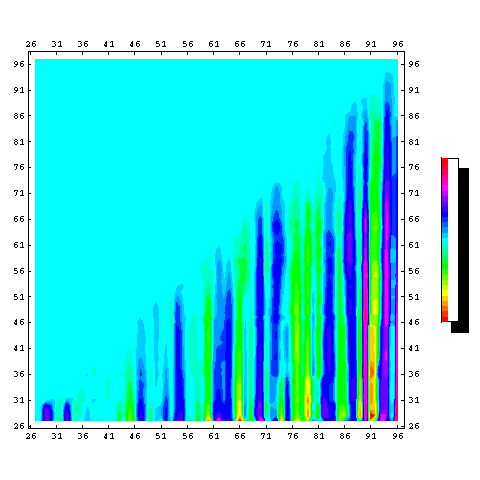

These graphics display the excess return over the market of vintage market portfolios. Want to know more? Watch this site...


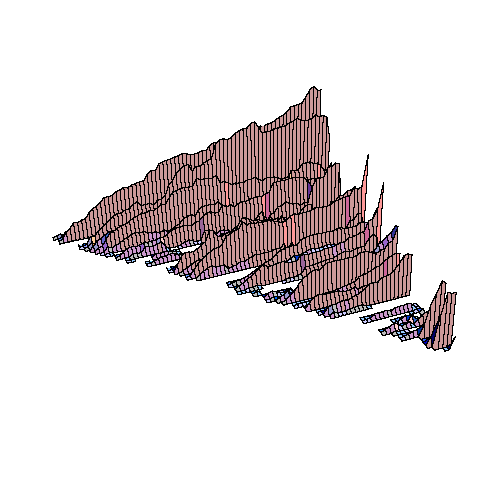
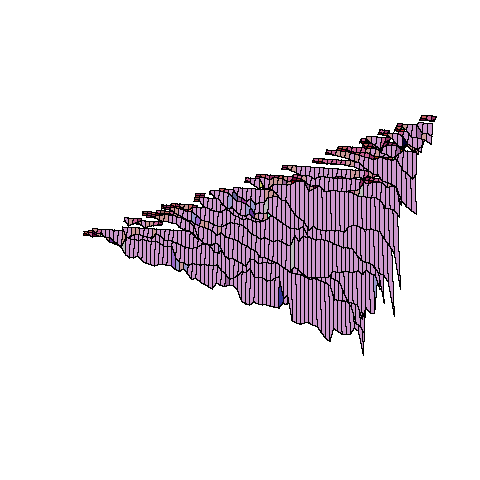
The following are 3 Dimensional representations of the contour maps above. The first is a view of the positive deviations. The next is a view of the negative.

